The purpose and goals of this assignment are to investigate foreclosures in Dane County while using z-scores, probability, and the add field tool. Furthermore, the experience acquired from this assignment in beneficial in helping to relate the calculated information (Z-Scores and Probability) to a situation for pattern analysis.
Key Terms
Z-Score: A Z-Score, also known as a standard score, is a number that indicates how many standard deviations an element is from the mean and can be placed on a normal distribution. Fig. 1 is the forumla for the Z score, where Zi: Z -score, Xi: number of observations minus the mean, divided by the standard deviation.
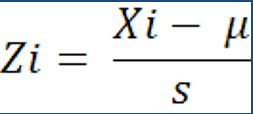 |
| Figure 1: Z-Score Formula |
Probability: Probability is the likelihood, by percent, that a numeric valued event will occur. The probability is derived from the z-score, then finding the Z-Score on a probability chart (Fig. 2).
 |
| Probability Chart of Z-Scores |
The Situation
You have been hired by an independent research consortium to study the geography of foreclosures in a Dane County, Wisconsin. County officials are worried about the increase in foreclosures from 2011 to 2012. As an independent researcher you have been given the addresses of all foreclosures in Dane County for 2011 and 2012 and they have been geocoded and then added to the Census Tracts for Dane County. While you realize that you cannot determine the reasons for foreclosures occurring, you do have the tools to analyze them spatially. Specifically, you are interested to see how the patterns of these foreclosures have changed from one year to the next. Explain what the patterns are and also provide some understanding as to the chance foreclosures will increase by 2013?
After the calculation of the Z-Scores for the three tracts location in Dane County, a second question was given:
If these patterns for
2012 hold next year in Dane County, based on this Data what number of foreclosures
for all of Dane County will be exceeded 70% of the time? Exceeded only 20% of the time?
Methods
First, a map was to be created displaying the change between 2011 and 2012 in foreclosures in Dane County, Wisconsin using ArcMap (Fig. 4). A field was added to the attribute table, followed by using the field calculator to subtract the 2012 foreclosure value from the 2011 value. The results offered a standard deviation classification and the ability to look at the differences between 2012 and 2011 regarding foreclosures in Dane County.
Next, the the instructions were to calculate the Z-Score for 3 specific tracts within Dane County (Fig. 3). Arcmap was then used to get the mean and standard deviation for both years of data. The values for each three specific tracts from both years was plugged into Microsoft Excel, which was eventually used to calculate the the six Z-Scores using Excel ( Fig. 7).
 |
| Figure 3: Specific Dane County Tracts: 122.01, 114.01, & 31 |
Results
While examining Fig. 4, you can see the areas which have had a increase in foreclosures shown by the darker brown color on the outside of the map. The areas with the green colors closer to the center of the county have seen a decrease in foreclosures since 2011. It appears that areas outside of the central capital area in the center of the county are the areas that have faced higher foreclosure rates.

 |
| Figure 5: 2011 Foreclosures |
 |
| Figure 6: 2012 Foreclosures |
 |
| Figure 7: Calculated Z-Scores of three specific tracts from 2011 and 2012 |
If these patterns for 2012 hold next year in Dane County, based on this Data what number of foreclosures for all of Dane County will be exceeded 70% of the time? Exceeded only 20% of the time?
Foreclosures that had a Z-Score greater than -.52 will be exceeded 70% of the time. This means that 70% of the time the foreclosures for a tract will exceed approximately 7.
Foreclosures with a Z-Score greater than .84 will be exceeded only 20% of the time This means that 20% of the time the foreclosures for a tract will exceed approximately 20.
Conclusion
Conclusion
There is a clear pattern of higher foreclosures on the outside of the county, surrounding the capital area of Dane County. There isn't sufficient information to do a full analysis why the pattern is this way; however, there were some things uncovered that were significant. Around this time, the economy was recovering from a recession, and people who moved to the outskirts of Madison didn't anticipate problems such as a market crash. In turn, this led to rural areas outside of an urban area having a higher chance of having foreclosures as well as larger tracts because of the more expensive mortgages that come with suburban properties. In order to find solution(s) for the high amount of foreclosures during this period, an investigation would have to be done to see how easy loans were given to these potential homeowners. If the loans were given too easily, maybe the solution would be to make it harder to get loans for certain people.
Are you in need of a loan? Do you want to pay off your bills? Do you want to be financially stable? All you have to do is to contact us for more information on how to get started and get the loan you desire. This offer is open to all that will be able to repay back in due time. Note-that repayment time frame is negotiable and at interest rate of 3% just email us (creditloan11@gmail.com)
ReplyDelete